The effect on the signal wave is very much dependent on its relative phase with respect
to the pump wave. Experimentally this phase is controlled by a mirror mounted on a
piezoelectric tranducer in the beam path of the signal wave. If the signal wave is in
phase with the pump wave, it gets amplified, if it is out of phase, it gets deamplified.
This behaviour is best visualized in
phase space.
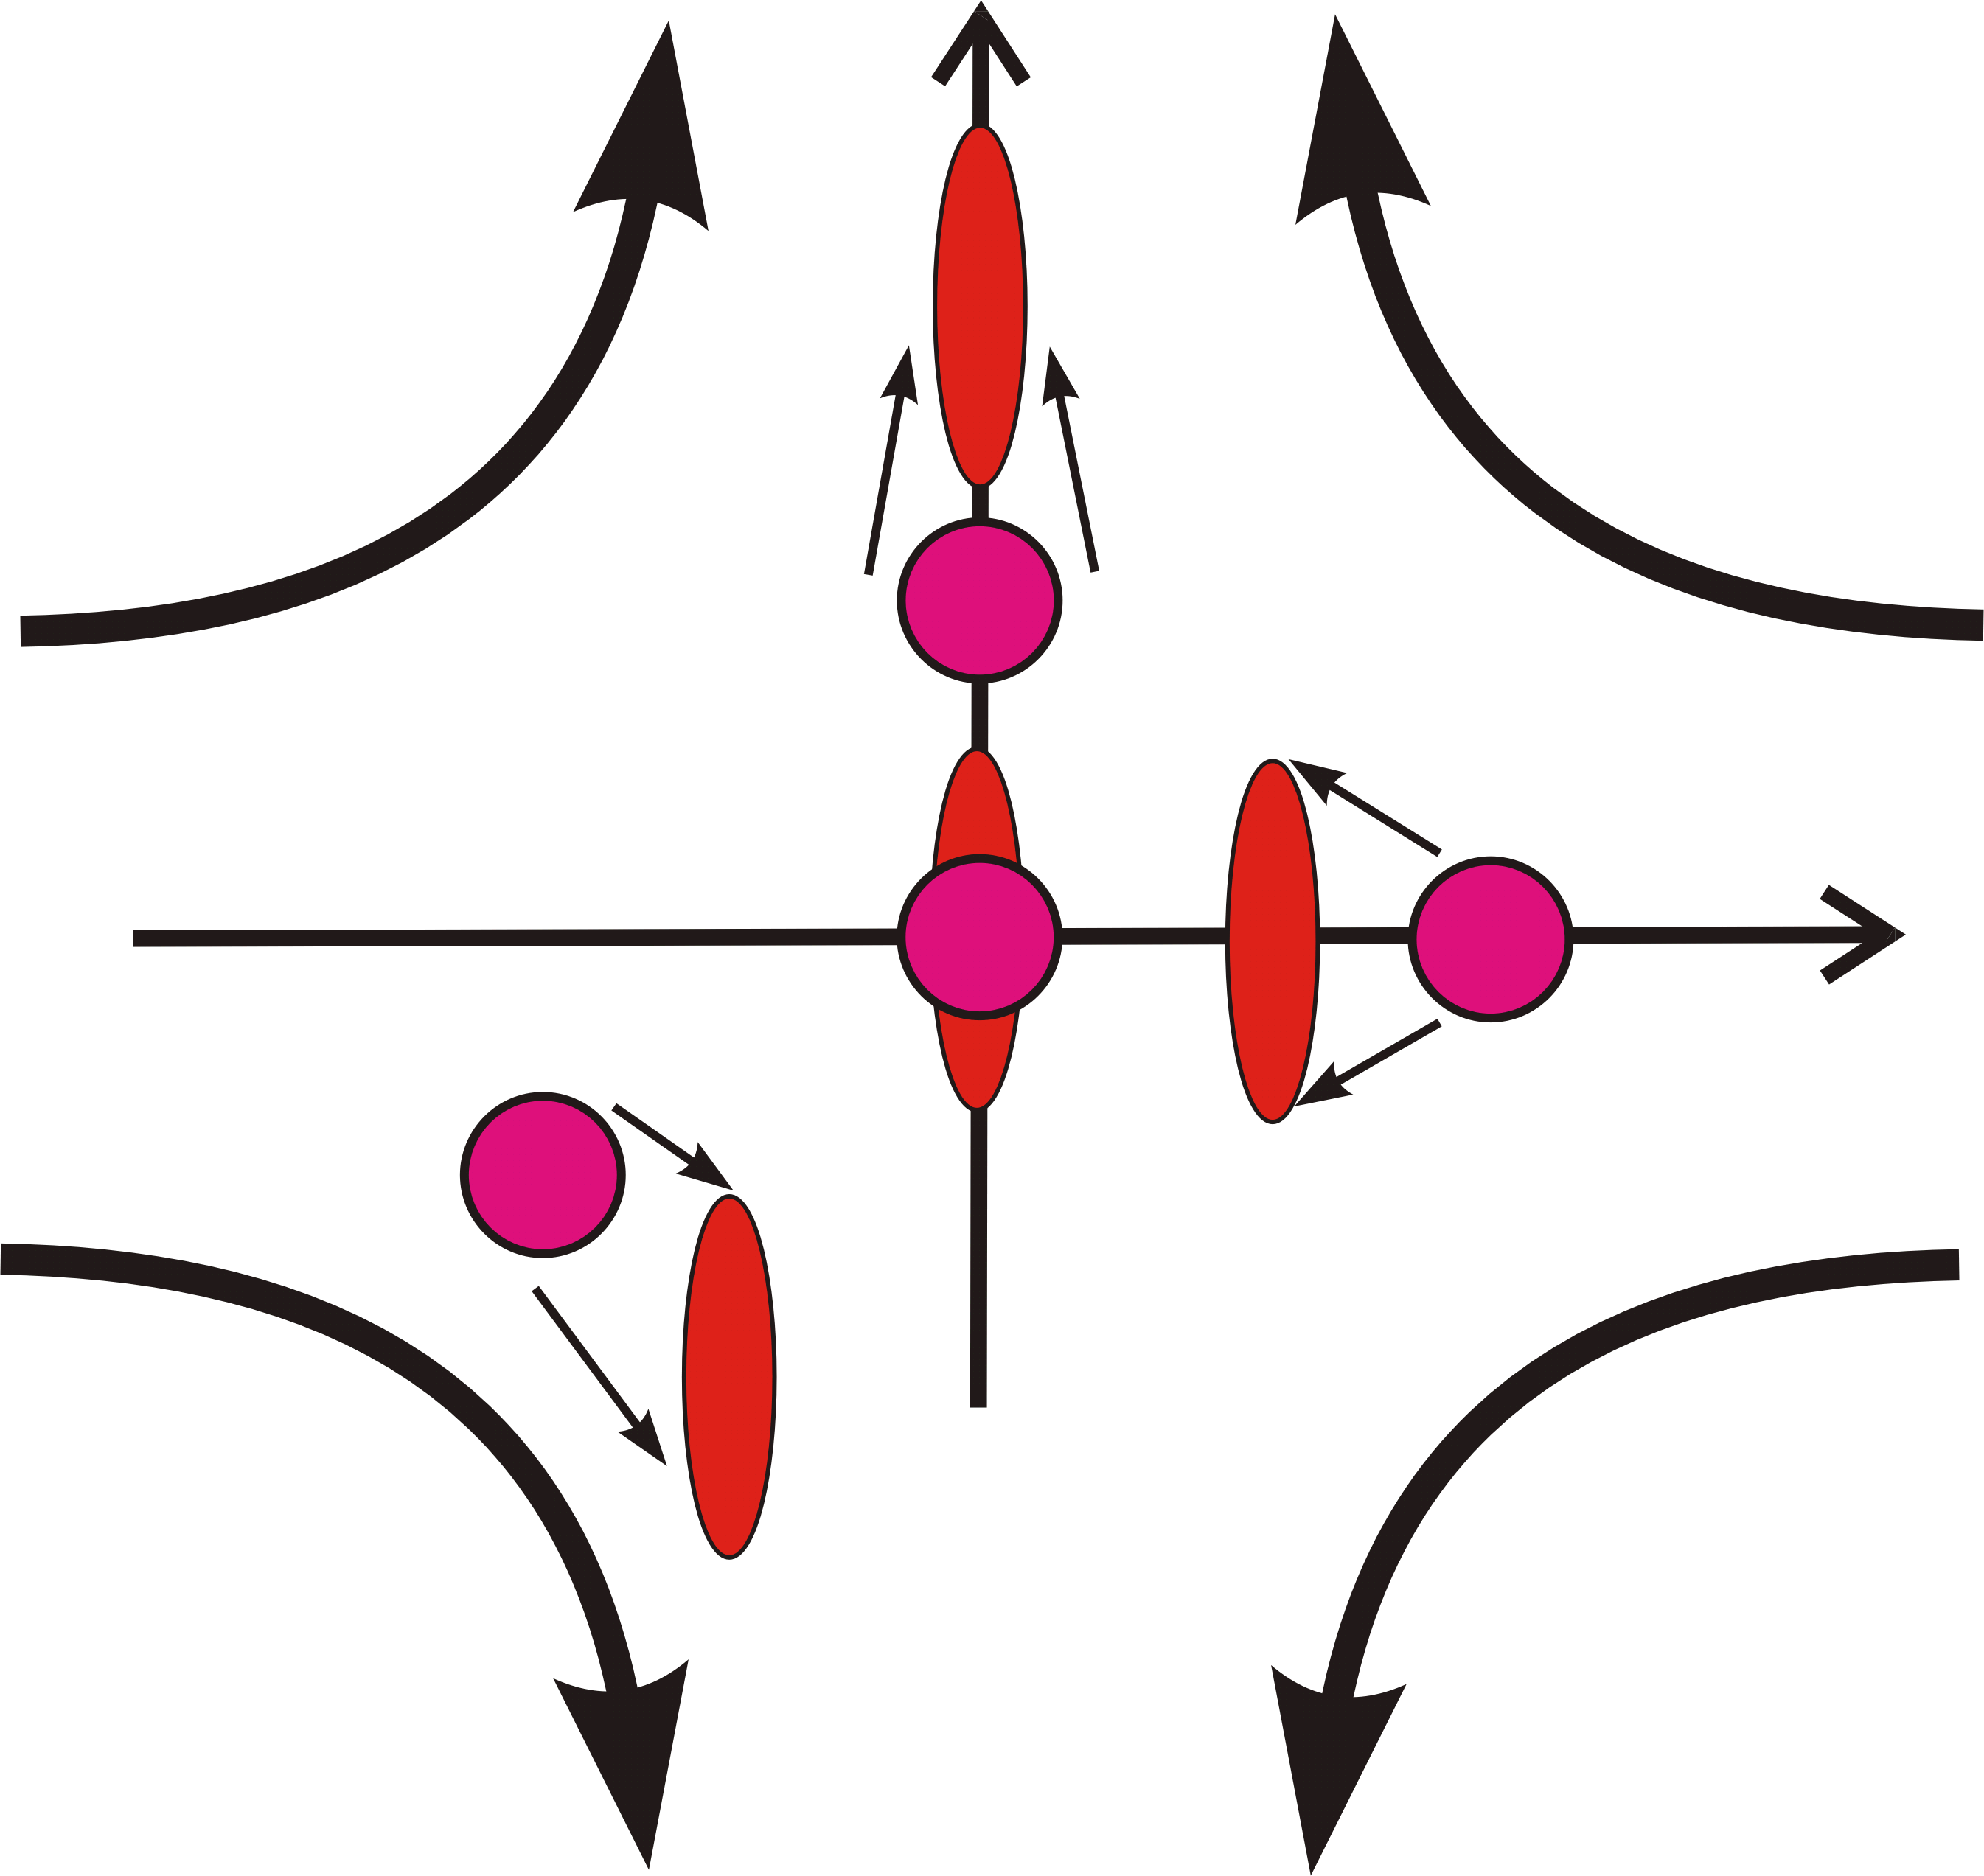
The light field's state is depicted by
its uncertainty area in phase space, which is just the contour (a horizontal cut) of its
Wigner function. The action of the pump wave in the nonlinear medium (mathematically
denoted as the squeezing operator) is a distortion of the phase space along
hyperbolic lines. In the picture below the purple circles indicate the coherent input
states out of which the squeezed output states (red) emerge. The phase angle of the
input states in these coordinates is given by the relative phase angle between pump and
signal wave. If the input state and the laser pump wave are in phase, the amplitude
of the input signal will be increased leading thus to a disproportional increase in amplitude noise
as well. If the input state and the laser pump wave are out of phase, the amplitude
of the input signal will be decreased leading thus to a disproportional decrease in amplitude noise
but an unavoidable increase in phase noise as well. Thus
it can be seen how all kinds of squeezed states can be generated by
altering the phase or the ampitude of the input state.
The first experiments of this kind were performed by Wu and Kimble (ref.8). The first squeezing
experiments in general by Slusher et al.(ref.7) (see also the book of Walls/Milburn and the article by A. Lvovsky (ref.6)).
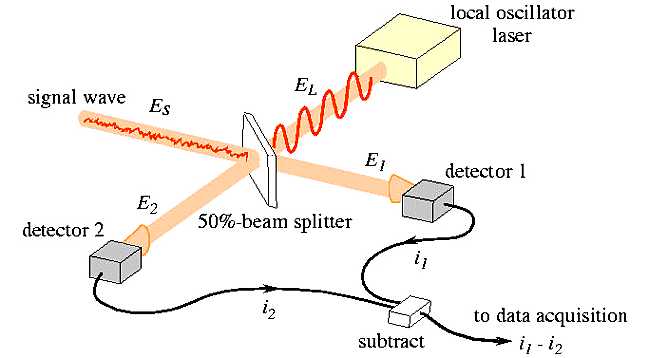
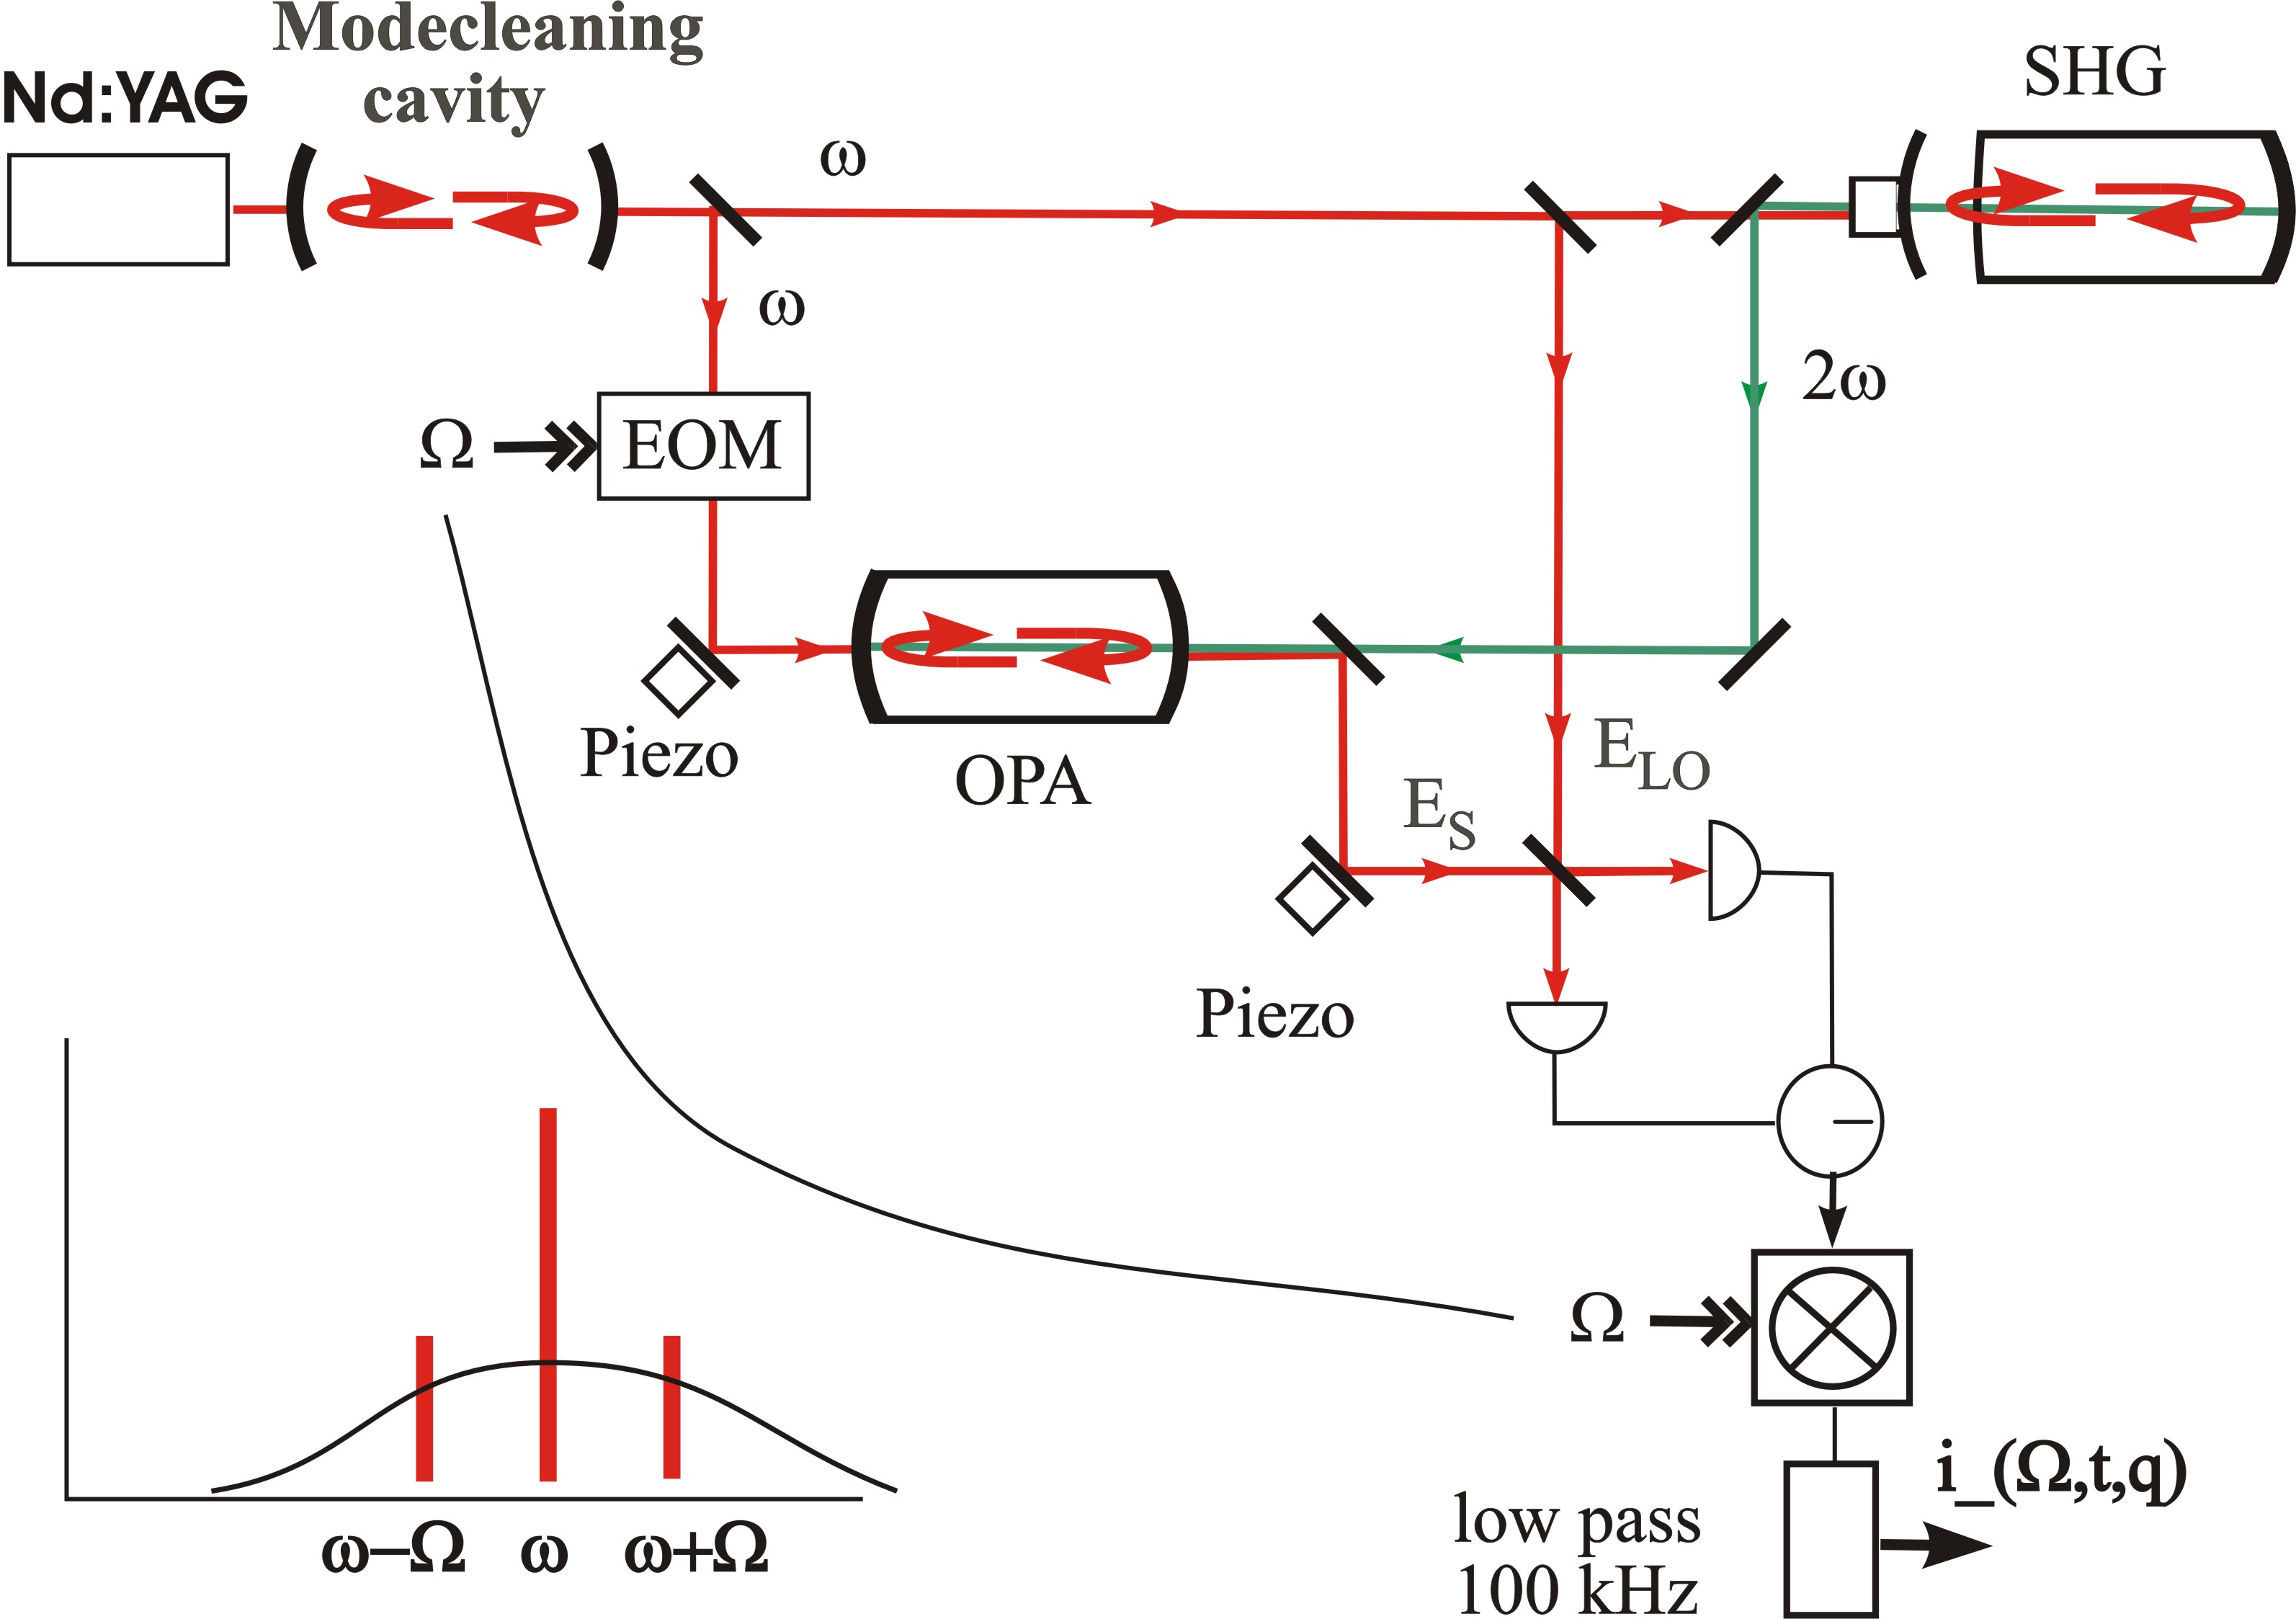
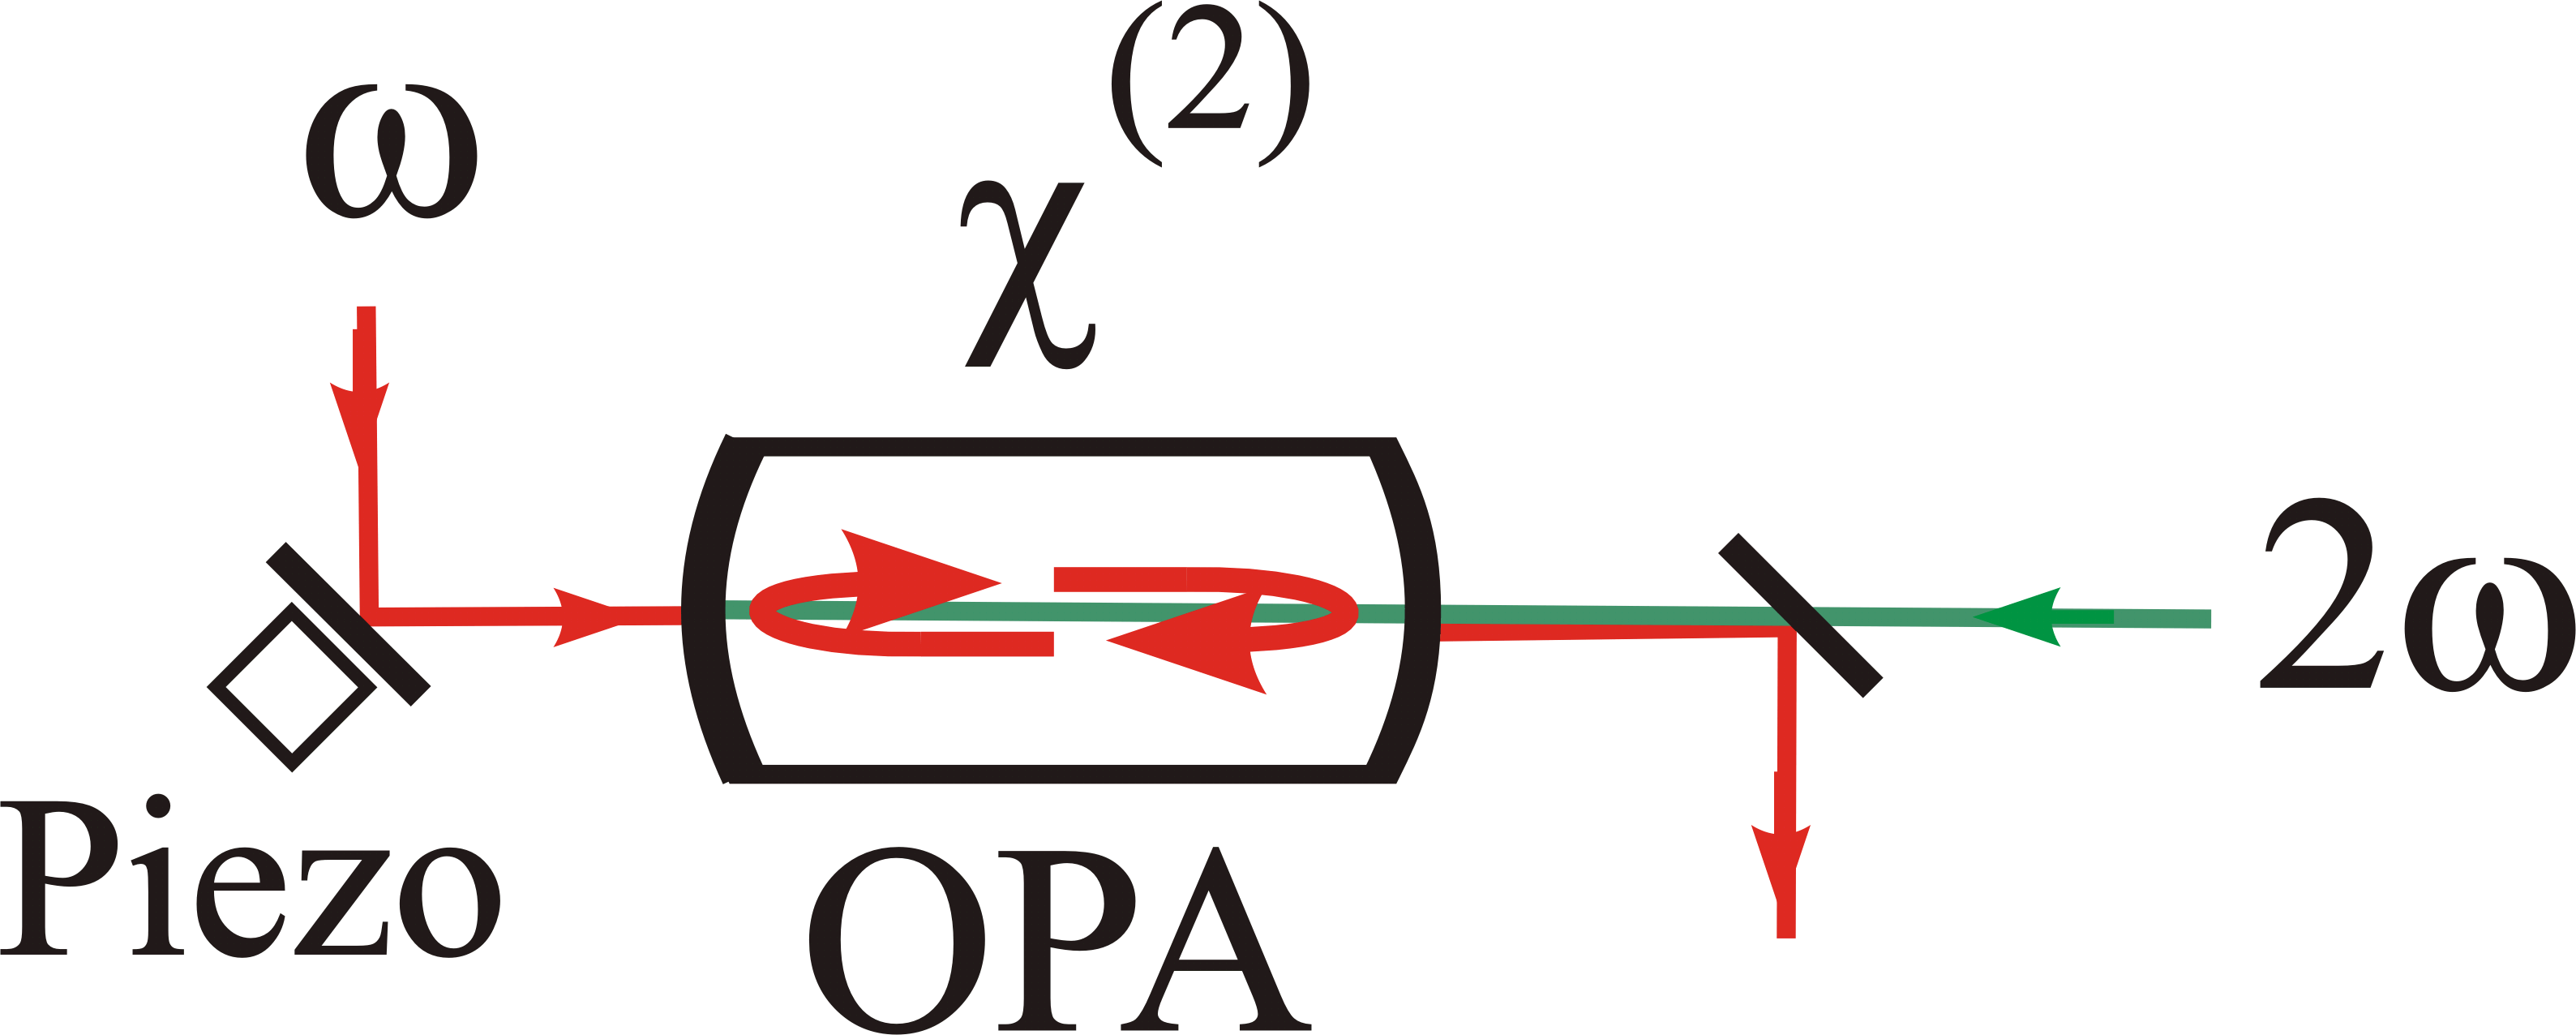
Scheme of the complete setup. The classical noise of the Nd:YAG-Laser is first removed by the modecleaning cavity. Then the main part is frequency doubled in the hemilithic cavity in the upper right corner (SHG, red to green). The signal beam is split off after the mode cleaning cavity and is first electrooptically modulated (EOM) and then injected into the optical parametric amplifier (OPA). The signal is amplified or deamplified depending on the relative phase with the strong green pump beam, with an according change in its quantum noise. The remaining green light is removed and finally the preparated signal beam enters the homodyne detector and is electrically analyzed by a very fast online data evaluation system, part of which is shown in the Java-Animation.
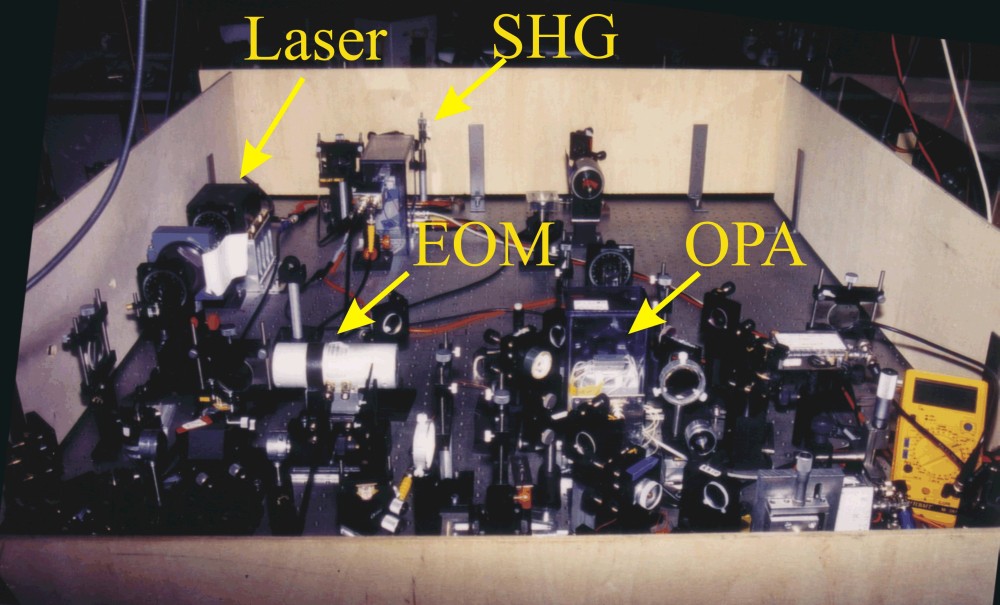
Main part of the actual setup in the laboratory (not seen: The filter cavity and all of the electronics
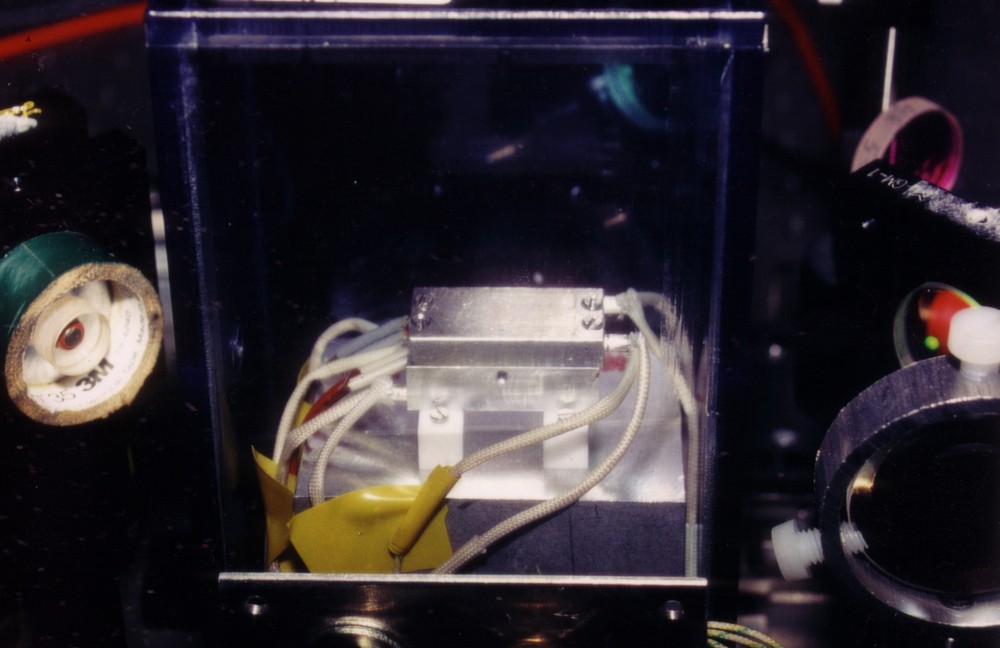
Detail of the actual setup in the lab: The oven with the heated monolithic OPA-crystal
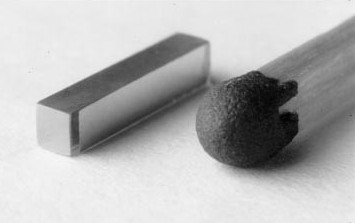
Fotograph of the OPO-crystal
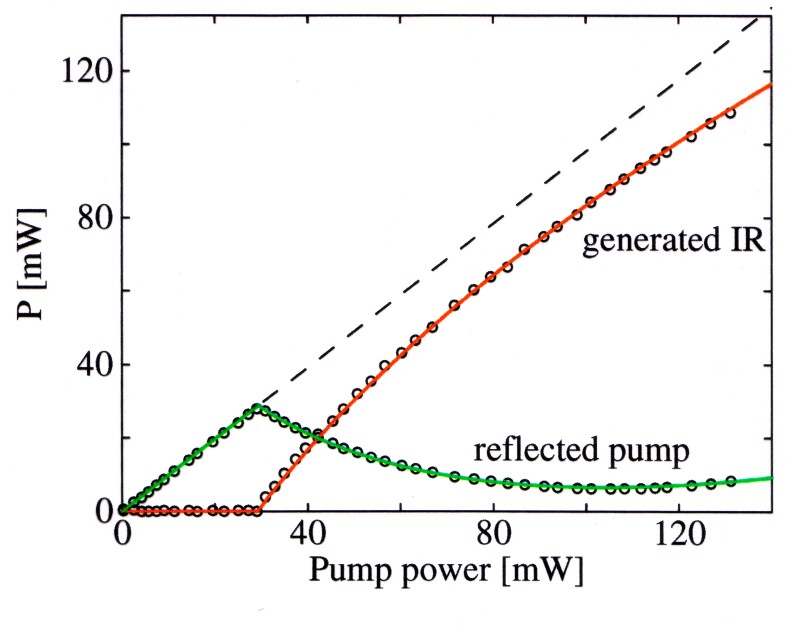
Measured data of the classical OPO-output. When the pump power (green) reaches the threshold of 28 mW the OPO starts to oscillate. Its power increases continually, but its efficiency reaches a maximum at 112 mW (four times the threshold). To my knowledge the 82% efficiency reached are still the world record of continuous wave frequency tunable external cavity optical parametric oscillation. The quantum mechanical measurement regime is below threshold, when there is "no" light emitted in classical theory (just random photon pairs) (ref 21).
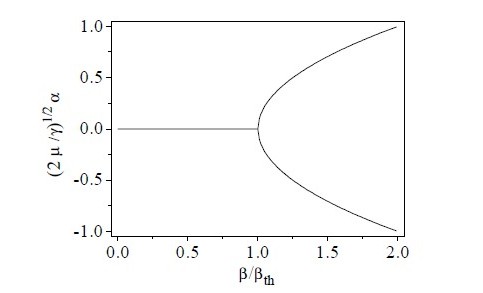
The very exciting theoretical prediction of the OPO behaviour just at its threshold is that it "doesn't know" at which point to begin its oscillation. It has to be in phase with the pump wave, but since the pump wave carries twice the frequency, there is an ambiguity in the phase, where. This ambiguity is called "optical bistability". The plot of the electric field amplitudes of the pump (x-axis) and the output (y-axis) reveals, exactly at threshold the output-field can "decide" to swing upwards or downwards thus exhibiting 180° phase difference. (ref. 25)
 |
 |
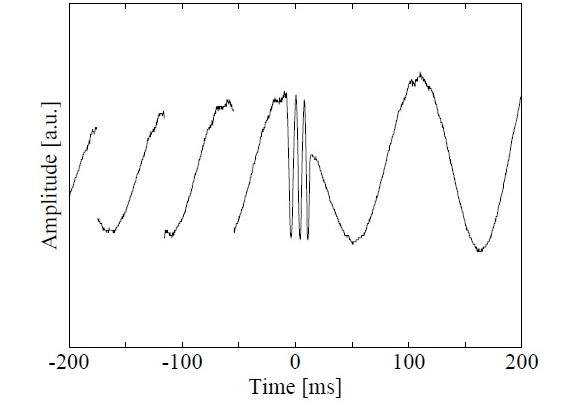
Left: The beat signal of the OPO-output just above threshold with a stable laser reveals
exactly the expected behaviour: every now and then phase jumps of 180° occur.
The OPO can oscillate both ways. The rapid oscillation in the middle of the plot is due to
the flyback of the piezo, scanning the light's relative phase.
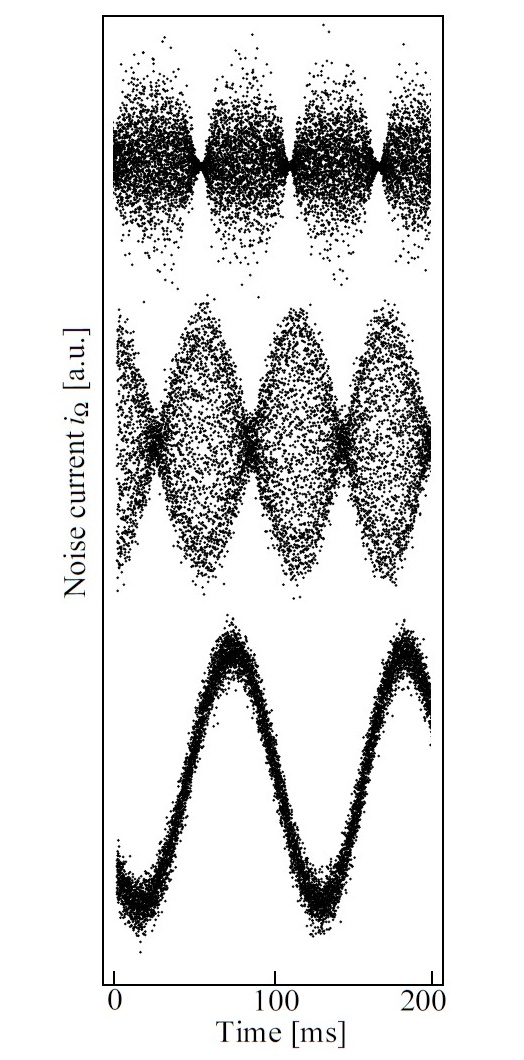
Right: The corresponding measured laser noise at three stages just below, at and above
threshold. First very strong 23 dB anti-squeezing can be seen, then at threshold the main field
amplitudes are in the characteristic sine form, but change rapidly between the two opposite
phases, at last above threshold the OPO has "chosen" its phase and the resulting output is a
coherent state
(see ref_dissertation).
It should be mentioned that this astonishing (classical) behaviour, strong
squeezing below and bistability above threshold has been demonstrated very nicely
for mechanical oscillators as can be seen in ref 16.
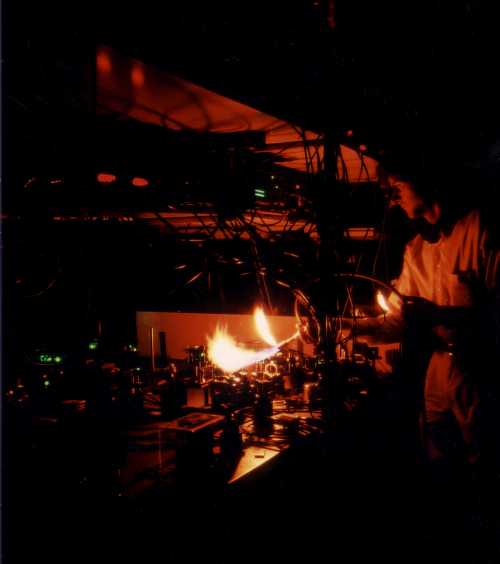
The author in a desperate attempt to produce thermal light
![]()